How and Why to Setup Heatmaps on Your Site
Heatmaps are a tool that can be used to view points of interest on specific pages of your site. It keeps track of where clicks happen so you can better understand your users’ behavior and optimize accordingly.
Heatmaps are a sort-of premium tool of analytics. This means there aren’t any free options out there, so go into it expecting to pay for the services.
In this article, we’ll be discussing the benefits of heatmaps and how to get them set up on your site.
Heatmaps 101
Not only do heatmaps give you great information (where your visitors are clicking), but they do so in a visually appealing way.
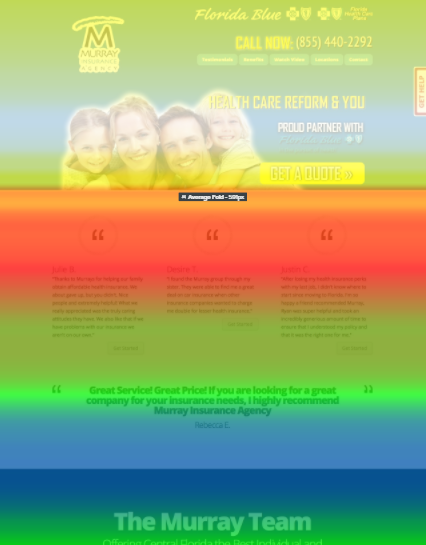
On a heatmap, the heat, or light, shows the concentration of clicks on a specific part of the page.
The more clicks in a specific area, the “hotter” the color will get. So the blue and purple tones are lower-activity areas while the red, orange, and yellow signify more concentrated clicks.

How to Optimize Using Heatmaps
It’s important to know when and why to optimize your pages. You’ll be able to make good changes, but only if you look at the data correctly. Here are some tips on how and when to optimize based on your heatmaps information.
Gather Enough Data
First, you want to make sure that you have enough data to actually make a difference. You don’t want to start tinkering with buttons and the organization of your site with data from 50 visitors.
Depending on the traffic of the site that you’re managing, the sufficient amount of visitors to make changes will change, but we recommend waiting until you have about 1000 visitors tested on the page.
This number will provide a sample for you to really take a look at the information and start thinking about changes.
Modify Unlinked Items that are Gathering Clicks
Look for anything that has a decent amount of clicks, but doesn’t actually link to anything. If users think that they can click on something, but nothing happens, they may think that the page is broken. It can be an image, a textbox that looks like a button, or maybe a social icon.
If you have something on your page that is getting clicks but doesn’t link to anything, there’s room for improvement.
First of all, think about the goal of the page. Is linking the user off of the page going to help accomplish that goal? If so, utilize those potential clicks and link the objects to a relevant page. If not, make the objects look less clickable. For example, change the style of text boxes that look like buttons, removing borders and changing the wording if you have to.
For images, make them smaller and make sure that the mouse doesn’t change to a hand when the user hovers over it. This can be done with CSS. Hover over the code below to see how your cursor changes. Doesn’t the pointer seem like it should be a link?
img {cursor: default;} img {cursor: pointer;}
Make Links Stand Out
If the “heated” areas of the heatmaps aren’t focused on where you want it, there’s a chance that your links don’t stand out enough. Focus on the button or text that you’re wanting the user to click. Does it look clickable?
Text should be underlined and, whenever possible, the traditional blue link color. Make buttons stand out visually, usually including a border and changing color or size when hovered over. Also, make sure that the text is a clear Call to Action like Learn More, Shop Now, or Request Free Consultation.

Scrollmap
Another analytics option that is related to heatmaps is the scrollmap. It’s not as common because it serves a pretty niche purpose, showing how much time was spent on each section of a specific page. The lighter the color, the more time was spent there. (White, yellow, orange, red, green, and blue)
So, in the example below, you can see that the blue section has no content in it. That explains why it’s the section of the page that received the least amount of time spent.
How to Setup Heatmaps
In order to take advantage of the analytics and data of heatmaps, you’ll need to subscribe to a service. Luckily, there are a few options that get the job done at a reasonable price.
![]()
Crazy Egg – (https://www.crazyegg.com/)
Crazy Egg is my go-to service for using heatmaps and scrollmaps on the sites that I manage. It’s very simple and intuitive, so I’ve never had an issue with it. They also offer A/B testing services.
 Crazy Egg offers a 30 day trail and costs roughly $9/month, billed yearly at $108.
![]()
VWO – (https://vwo.com/)
I currently use VWO for A/B testing for all of my clients, but haven’t started using them for heatmaps. Unlike Crazy Egg, they don’t offer scrollmaps. It’s worth looking into if you’re already using them for A/B testing and want to keep your data together.
VWO bills on a per-user-basis, so visit their site to check their pricing options.